Fluorescence microscopy was utilized to identify and quantify the number of regulatory T cells present in the tumor and spleen samples. Fluorescence microscopes emit wavelengths of light that excite the fluorophores, marking particular antibodies. The absorbance of light by these fluorophores results in the emission of energy, which is subsequently visualized through the use of a filter designed specifically for that wavelength.
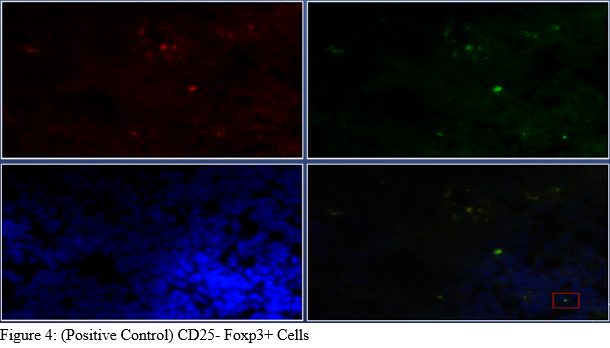
CD25 antibody fluoresced red under the PE filter, whereas Foxp3 antibody fluoresced green under the FITC filter, and Hoechst dye fluoresced blue under the DAPI filter.
Each tissue sample necessitated the consideration of all three fluorescence. In the fluorescence microscopy images (Figures 1, 2, 3, and 4), the upper left quadrant, upper right quadrant, and lower left quadrant display the presence of CD25, Foxp3, and cell nuclei, respectively. The lower right quadrant is an image overlaying the fluorescence of the CD25 antibody, Foxp3 antibody, and Hoechst dye applied. Points at which all three fluoresced are CD25+Foxp3 cells in phenotype and were identified as Tregs.
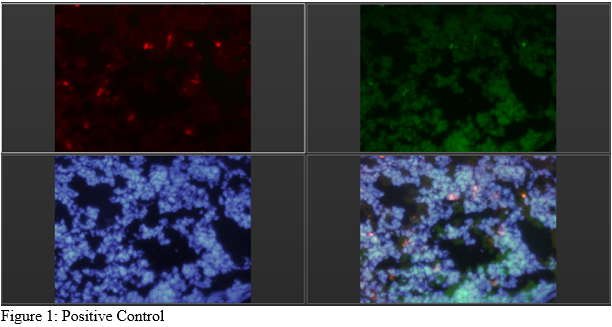
Figure 2 consists of fluorescence microscopy images of a negative control tissue sample. These samples were only stained with Hoechst dye. Consequently, there is no fluorescence of CD25 or Foxp3 in the upper two quadrants. Negative control samples were visualized to verify that the antibodies applied were responsible for causing CD25+ and Foxp3+ fluorescence.
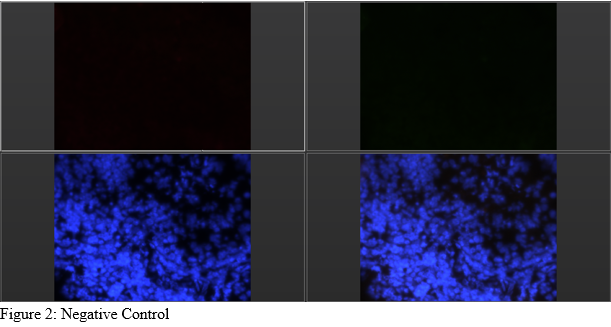
Figure 3 contains fluorescence microscopy images of a positive control tissue sample. The red, green, and blue fluorescence is indicative of CD25, Foxp3, and nuclei, respectively. Cells identified as CD25+ Foxp3+ regulatory T cells are boxed in the lower right image.
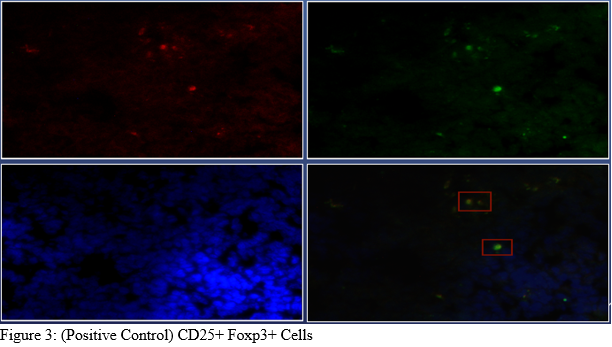
Figure 4 displays fluorescence for the same field of view presented in Figure 3. However, the cell boxed in the lower right image is a CD25- Foxp3+ cell.
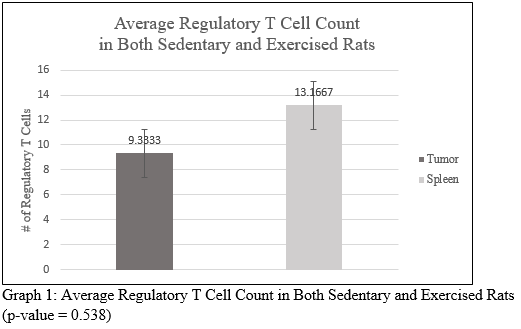
Graph 1 depicts the average regulatory T cell count in the tumor samples in comparison to the average regulatory T cell count in the spleen samples. More regulatory T cells were present, on average, in the lymphoid tissue (spleen) than in the tumor microenvironment.
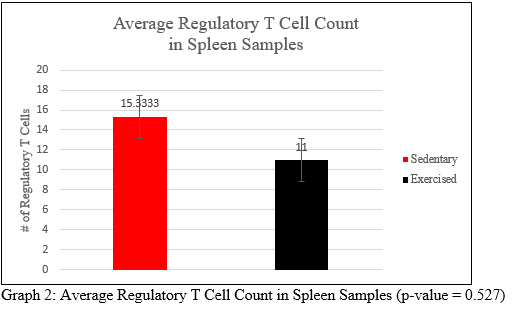
Graph 2 depicts the average regulatory T cell count in the spleen samples of the sedentary group in comparison to the average regulatory T cell count in the spleen samples of the exercised group. More regulatory T cells were present, on average, in the spleens of the sedentary group than in the spleens of the exercised group.
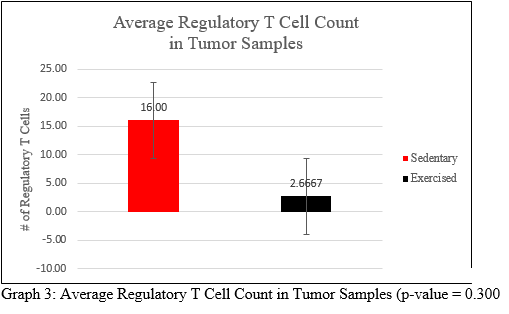
Graph 3 depicts the average regulatory T cell count in the tumor samples of the sedentary group in comparison to the average regulatory T cell count in the tumor samples of the exercised group. Considerably more regulatory T cells were present, on average, in the tumors of the sedentary group than in the tumors of the exercised group.
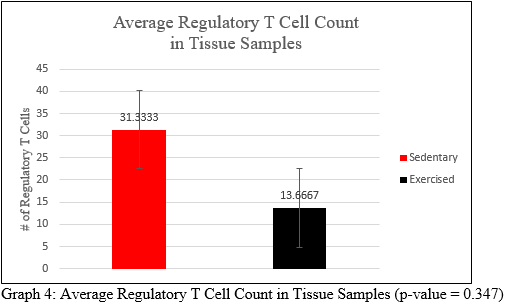
Graph 4 depicts the average regulatory T cell count in the tissue samples (spleen and tumor combined) of the sedentary group in comparison to the average regulatory T cell count in the tissue samples of the exercised group. Substantially more regulatory T cells were present, on average, in the tissues of the sedentary group than in the tissues of the exercised group.